


Sales Engagement Analytics: The Metrics That Matter
Sales engagement analytics is the measurement of every interaction between you and your prospects: texts, emails, calls, replies and booked appointments. It tells you how fast you respond, which messages get answers, and where leads go quiet. This guide covers the metrics worth tracking, how to read them, and how a solo agent or small team can build a review routine that takes about 20 minutes a week.
AstreauxRespond to leads without delayAstreaux uses conversational AI to engage new leads with personalized responses and streamline scheduling for service professionals.Book a call
TL;DR
Sales engagement analytics measures outreach activity and prospect response, not just closed revenue. It explains why deals move or stall.
Track a short list: speed to first response, reply rate, booked-appointment rate, no-show rate and stage-to-stage conversion.
Separate activity metrics (what you did) from outcome metrics (what happened). Fixing activity only matters if outcomes follow.
Review weekly by lead source and by channel, then change one variable at a time.
Automation makes the data cleaner, because every reply, follow-up and booking is logged without manual entry.
What sales engagement analytics actually measures
Your CRM answers the question “where is each deal?” Engagement analytics answers a different one: “what happened between us and this prospect, and did it help?” Industry analysts describe sales engagement as covering all interactions and touchpoints between sales teams and customers across the sales process, which goes beyond what a contact record stores. Analytics is the layer that turns those touchpoints into numbers you can compare week over week.
For a real estate agent, that might mean: of the 40 Zillow inquiries last week, how many got a reply in under five minutes, how many answered back, and how many booked a showing? For a contractor, it is the share of web-form leads that turn into a scheduled estimate. For an insurance agent, it is how many quote requests got a second touch within a day.
It is not the same as general sales analytics. Sales analytics looks at revenue, quota and forecast. Engagement analytics looks upstream, at the behaviors that produce those results. You need both, but the engagement view is the one you can change this week.
Activity metrics versus outcome metrics
The most common mistake is counting what is easy. Messages sent, calls dialed and emails opened feel productive, but they are inputs. Research from Macropraxis on which sales KPIs drive consistent revenue organizes metrics into a hierarchy that starts with inputs (activity) and moves through conversions (pipeline progression) toward results. Use the same logic for your own dashboard:
Layer | What it tells you | Examples |
|---|---|---|
Activity | What you and your tools did | Texts sent, follow-ups completed, calls placed |
Engagement | How prospects responded | Reply rate, time to reply, conversation length |
Conversion | Whether leads progressed | Booked appointment rate, show rate, stage-to-stage rate |
Outcome | Revenue results | Closed deals, revenue per lead source |
If activity rises and conversion stays flat, you are doing more of the wrong thing. If engagement is strong but bookings are weak, the problem is the call to action or the scheduling step, not lead quality.
The seven metrics to track first
More dashboards do not mean more insight. Gartner notes that sales operations leaders struggle to generate actionable insights from the overwhelming amount of engagement data, which limits what they can improve. Start with seven numbers and add more only when a question demands it.
1. Speed to first response
Measure the minutes between a lead’s inquiry and your first meaningful reply. Track the median, not the average, because one lead answered at 2 a.m. will distort a small sample. Also track the share of leads answered within five minutes. This is the one metric where automation changes the answer overnight, since an AI reply can go out in seconds regardless of whether you are in a showing or on a roof.
2. Reply rate
Reply rate is the percentage of leads who respond to your first outreach. Split it by channel (SMS, email, phone callback) and by lead source. A low reply rate from one source often points to intent: a portal lead who clicked “contact agent” on a dozen listings behaves differently from a referral.
3. Positive reply rate
Not every reply is good news. Tag responses as interested, neutral, not now or opt-out. A rising reply rate with a falling positive share means your messaging is generating noise.
4. Booked-appointment rate
Of the leads that engaged, what percentage booked a showing, estimate, consultation or call? This is the bridge between engagement and revenue, and it exposes friction in your scheduling flow. If prospects reply “yes, Thursday works” and never receive a link or confirmation, you will see it here.
5. No-show rate
Bookings that do not happen are lost time. Compare no-show rates between appointments confirmed instantly and those confirmed hours later, and between those with a reminder and those without. Small changes to reminders often move this number more than any change to lead generation.
6. Follow-up depth
How many touches does a lead get before you stop? Plot conversions against touch number. Many teams find that bookings keep arriving at touches three, four and five, which is exactly where manual follow-up usually dies. Our guide on automating lead follow-up for small sales teams walks through setting that cadence.
7. Stage-to-stage conversion
For each pipeline stage, what percentage of leads advance, and how long do they wait? Slow, stuck stages are where revenue leaks. If you have not defined your stages around buyer actions yet, start with our explanation of pipeline stages that move on buyer behavior.
A worked example: a contractor’s weekly numbers
Here is an illustrative example with made-up numbers, to show how to read the metrics together. It is not a benchmark.
A remodeling contractor receives 60 leads in a week: 30 from a home-services marketplace, 20 from the website and 10 from referrals.
Median first response: 47 minutes for marketplace leads, 3 hours for website leads, 20 minutes for referrals.
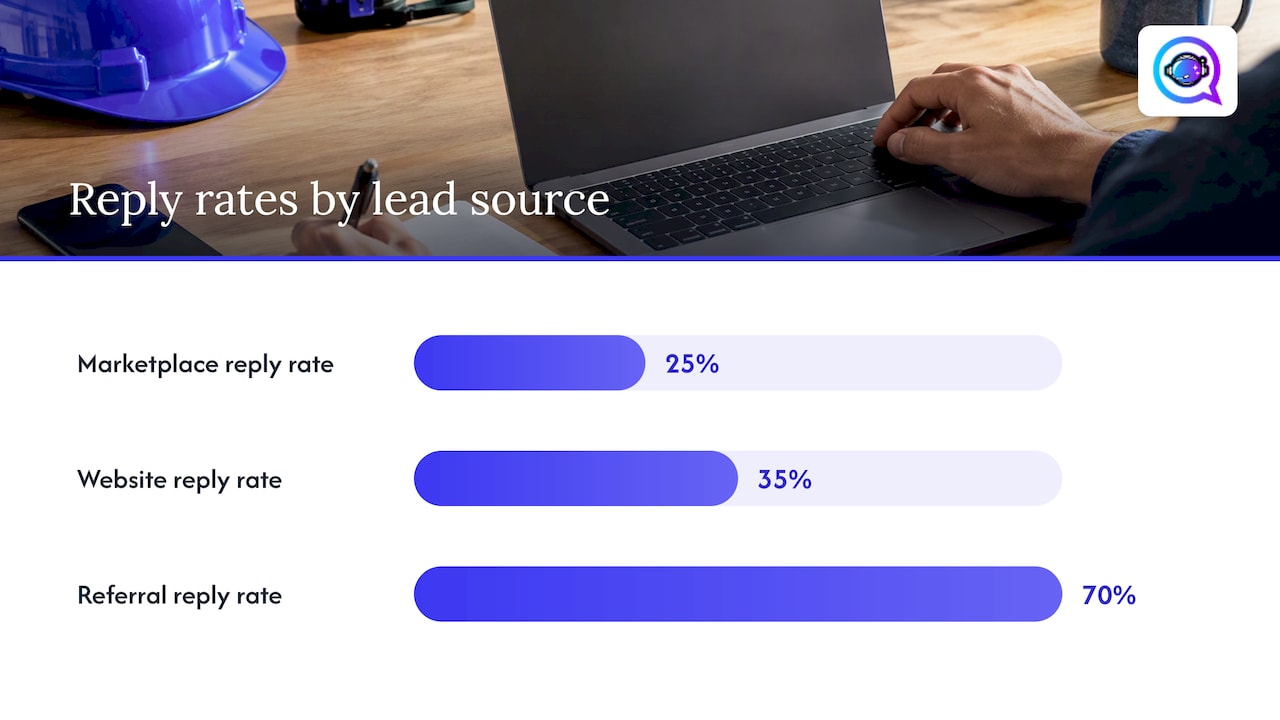
Reply rate: 25% for marketplace, 35% for website, 70% for referrals.
Booked estimates: 4 from marketplace, 5 from website, 6 from referrals.
No-shows: 3 of the 15 booked estimates.
What the numbers say: marketplace leads are slow to be answered and reply less, so the first win is speed. Website leads reply well but wait three hours, so a faster first touch probably lifts bookings there too. Three no-shows out of 15 is one in five, so a same-day reminder is the second fix. Notice that none of this required a new lead source. It required reading the data by source and by step.
Change one variable, such as first-response time on marketplace leads, run it for two weeks and compare. If you change speed, message copy and reminders all at once, you will not know what worked.
How to read engagement data without fooling yourself
Small businesses work with small samples, so a few habits keep you honest.
Use ranges, not single points. Ten leads is anecdote. Look at four weeks at a time before declaring a trend.
Segment before you average. A blended reply rate hides the difference between a hot referral and a cold portal lead.
Be skeptical of open rates. Email privacy features can inflate or obscure opens. Replies and bookings are harder to fake.
Watch time, not just totals. Two sources can have the same booking rate while one takes six days and the other six hours.
Tie metrics to a decision. If a number cannot change what you do on Monday, drop it from the dashboard.
Engagement signals and AI: where the data gets better
Manual tracking has a built-in flaw: it depends on you remembering to log things. When a conversational AI handles first contact, every message, reply, timestamp and booking is recorded as a byproduct. That gives you cleaner response-time data and a full conversation history to review.
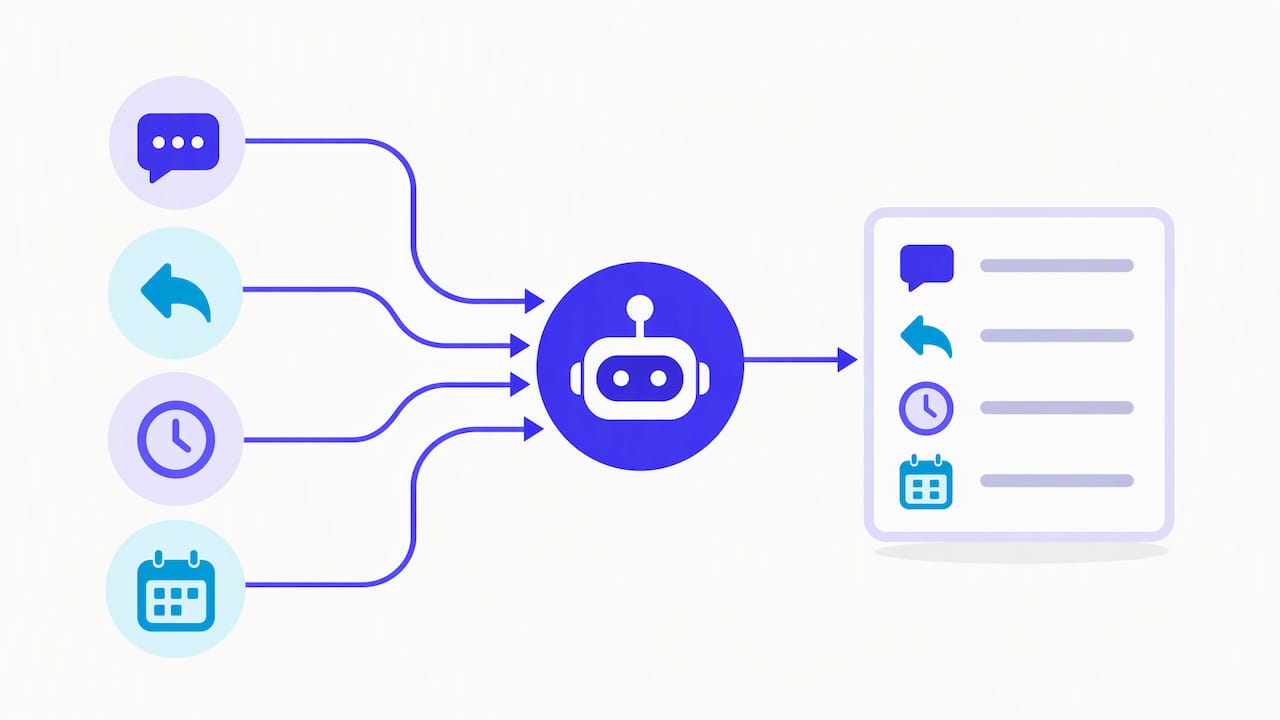
It also lets you act on signals faster. A lead who replies at 9 p.m. asking about pricing is showing intent. A lead who ignores three messages but clicks a scheduling link is too. Scoring those signals is a topic of its own, covered in our practical playbook on AI lead scoring, and the logic of qualifying before you book is in our piece on AI lead qualification for booking meetings.
Engagement across several channels also compounds. Looking at multi-channel funnel results is a useful way to see why a prospect who hears from you by text, email and a call is easier to read than one you reached only once. The analytics lesson is the same: record the channel with every touch, so you can see which combination precedes a booking.
Build a 20-minute weekly review
You do not need a data team. You need a routine.
Pull last week’s leads by source. Count them, then count first responses within five minutes.
Check reply and positive-reply rates for each source and channel.
Count bookings and no-shows. Note how long each booking took from first message.
Find the stuck stage. Which stage has the most leads older than a week?
Pick one change. Write it down with the date and the metric you expect to move.
Read five conversations. Numbers tell you where; transcripts tell you why. Look for questions the AI or you answered poorly.
Once a month, compare the last four weeks against the four before. That is your trend line.
Metrics by profession
The seven core metrics hold across service businesses, but the emphasis shifts.
Real estate agents: speed to response by portal source, showing-booked rate, open-house follow-up conversion. Our pages on open house follow-up and Zillow lead conversion show how those flows work in practice.
Contractors: estimate-booked rate, no-show rate and time from inquiry to estimate date.
Insurance agents: quote follow-up within 24 hours, second-touch rate, quote-to-call conversion.
Financial advisors and mortgage brokers: nurture depth, reply rate over a long cycle, consultation-to-engagement conversion.
Therapists: inquiry-to-first-session rate and reminder effectiveness on no-shows.
Our perspective: measure the gap between lead and reply first
We build software for service professionals, and the pattern we see in the problem is consistent: most small businesses do not lose leads because their offer is weak. They lose them in the minutes and days after the inquiry, when manual follow-up falls behind real work. That is why we tell people to begin analytics with response time and follow-up depth, not with a dozen dashboards.
We also think analytics should describe how your business sounds, not just how fast it is. A reply that arrives instantly but reads like a template can produce a fast response and a flat reply rate. That is why Astreaux learns each business’s voice, so the first message is both immediate and personal. When you review conversations alongside the numbers, you can tell whether the voice is working.
The third point is practical: data you have to enter by hand is data you will stop entering. With automated engagement and integrations with over 7,000 apps, replies and bookings flow into the tools you already use. The best dashboard is the one that fills itself in.
— Jamaal
Put your numbers to work with Astreaux
If you are ready to stop guessing, Astreaux gives service professionals conversational AI that replies to new leads instantly in your own voice, books appointments, nurtures prospects over time and reports on pipeline performance. It connects with CRMs and ad platforms, so engagement data sits next to your deals. You can start with a free trial or demo and measure your own response-time and booking numbers before and after.
Common mistakes to avoid
Tracking too much. A dashboard with 30 charts gets ignored. Start with seven.
Judging channels on volume alone. The channel with the most leads is not always the one with the most bookings.
Ignoring opt-outs. A rising opt-out rate is a message-quality warning. Keep outreach consistent with U.S. rules for texting and email, and check our guide to inbound lead automation and compliance for how we think about it.
Stopping at the booking. A booked appointment that no-shows is not a win. Track show rate, not just bookings.
Changing everything at once. One variable per test, two weeks per test.
FAQ
What is sales engagement analytics?
It is the measurement and analysis of all interactions between you and your prospects, including texts, emails, calls and replies, and how those interactions lead to bookings and deals. It focuses on the behaviors that come before revenue.
How is it different from sales analytics?
Sales analytics looks at outcomes such as revenue, quota attainment and forecast accuracy. Engagement analytics looks at the activity and response behind them, such as response time, reply rate and booking rate, so you can change what happens next.
Which metrics should a small business track first?
Start with speed to first response, reply rate, booked-appointment rate, no-show rate and stage-to-stage conversion. Add follow-up depth and positive reply rate once you have a few weeks of data. Review them by lead source, not as one blended number.
Do I need a CRM to do this?
A CRM helps, because it holds lead source and stage history. You can begin with a spreadsheet, but manual logging breaks down as lead volume grows. Tools that capture conversations and bookings automatically give you more reliable data.


